Conversation Transcript
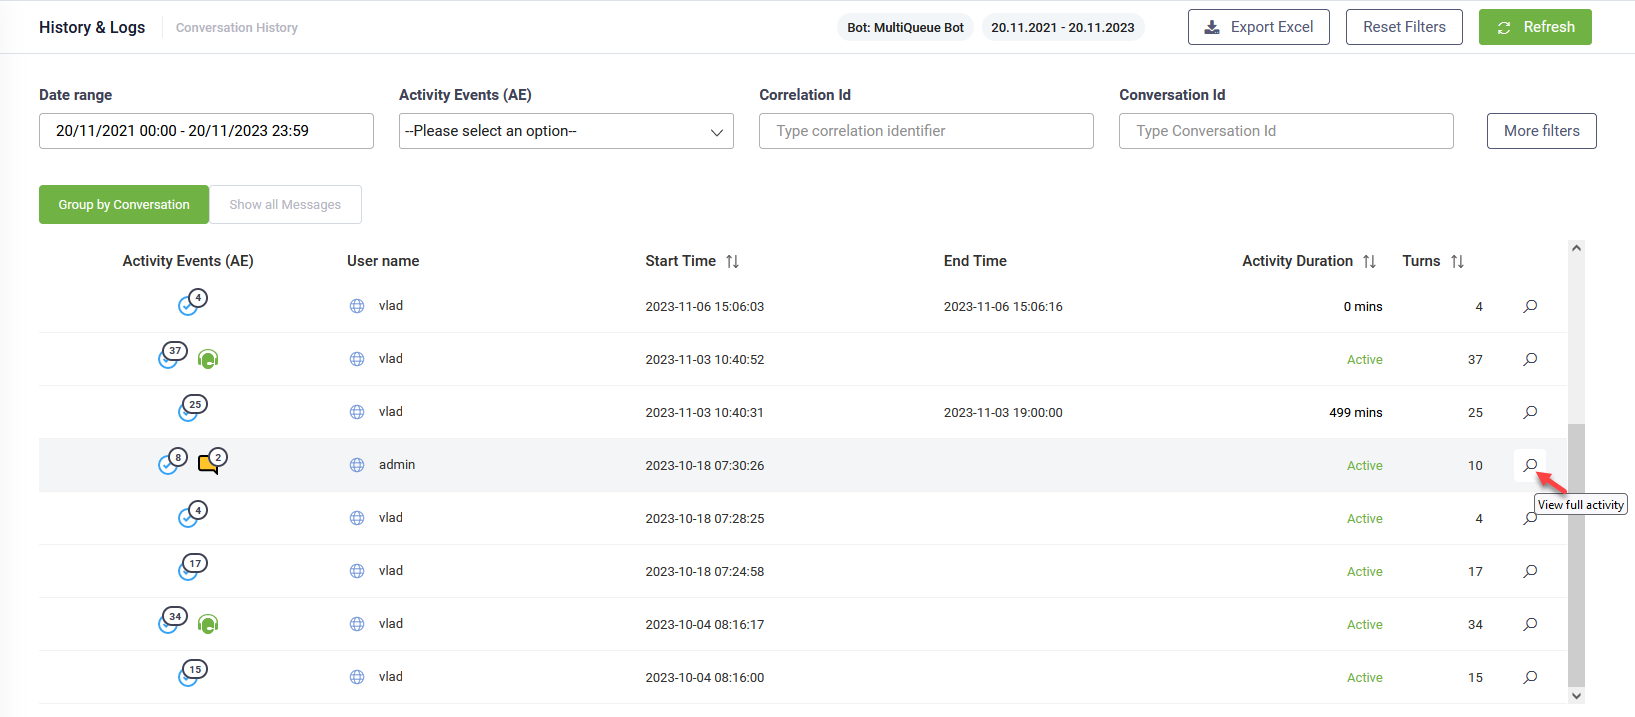
To see the full conversation transcript for a specific conversation, in the list of activities grouped by conversations, either click on the desired row or click the View full activity icon ( ) corresponding to the desired conversation.
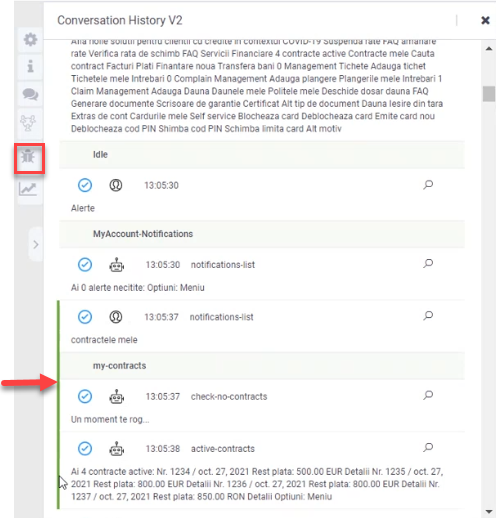
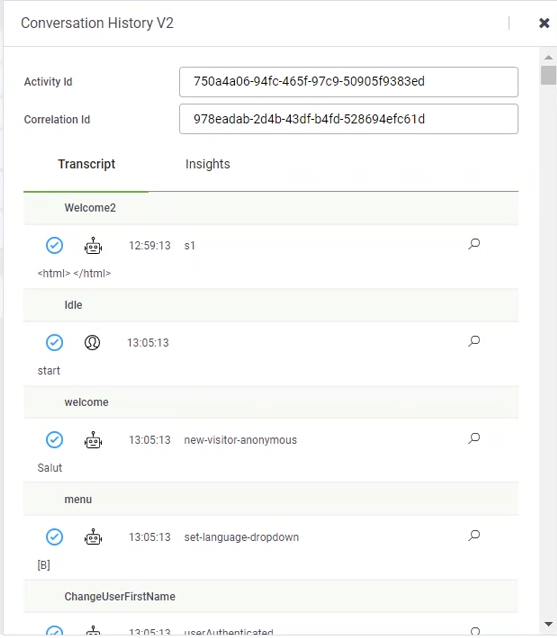
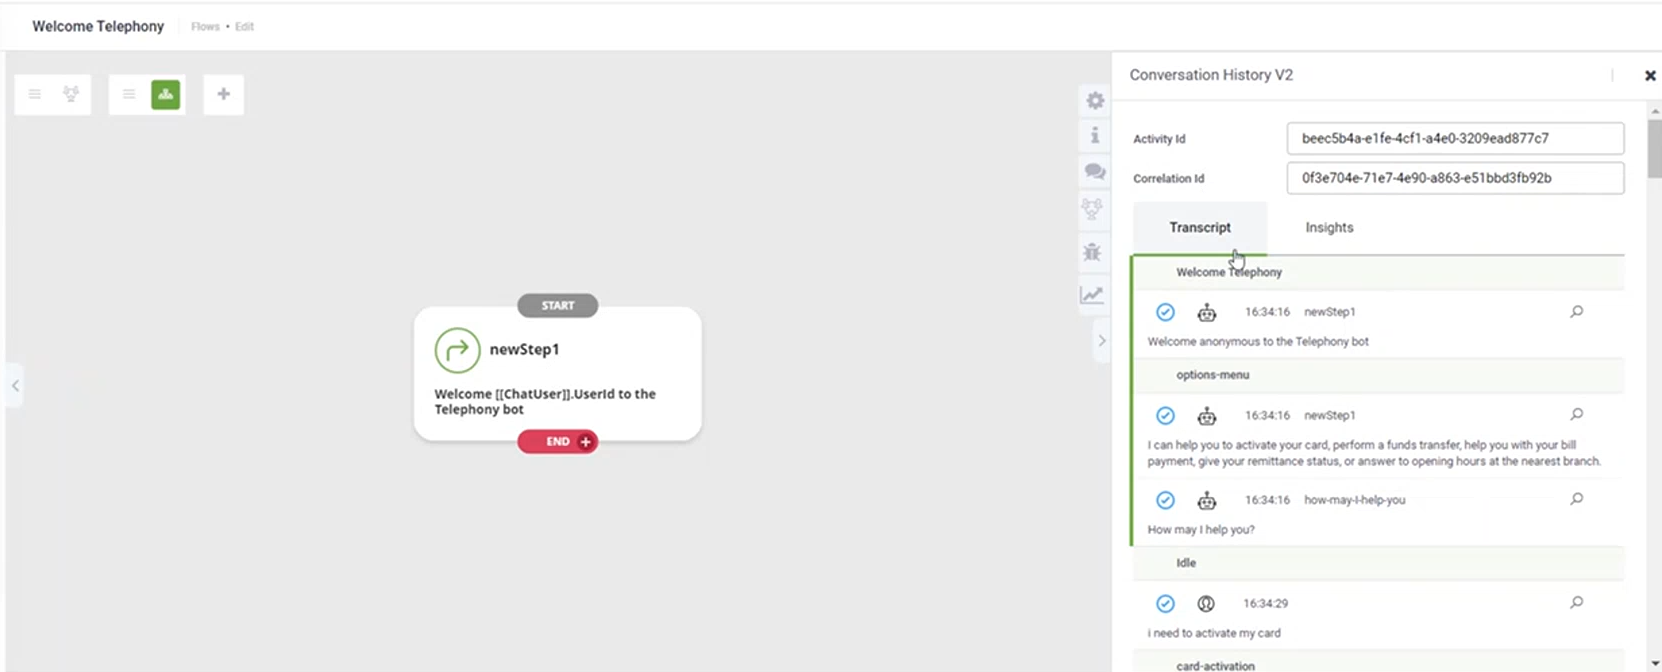
The conversation transcript provides you with all the messages sent during the conversation grouped by flows and detailed information per message to help you easily review what happened during the conversation:
- The activity event (icon).
- The message. In front of the message an icon indicating who sent the message:
 - the bot and
  - the user.
- The flow step where the message was sent.
The messages for which the bot did not match a flow are grouped under the Idle status.
![]()
The conversation transcript provides you with powerful tools to:
- Debug message details and integration log per flow steps.
- Debug messages in the flow diagram per flow steps.
- View analytics of a specific flow or flow step.
- Debug messages in the flow diagram per flow.
Debugging message details and integration log per flow steps
The Conversation transcript allows you to view message details and investigate the integration logs.
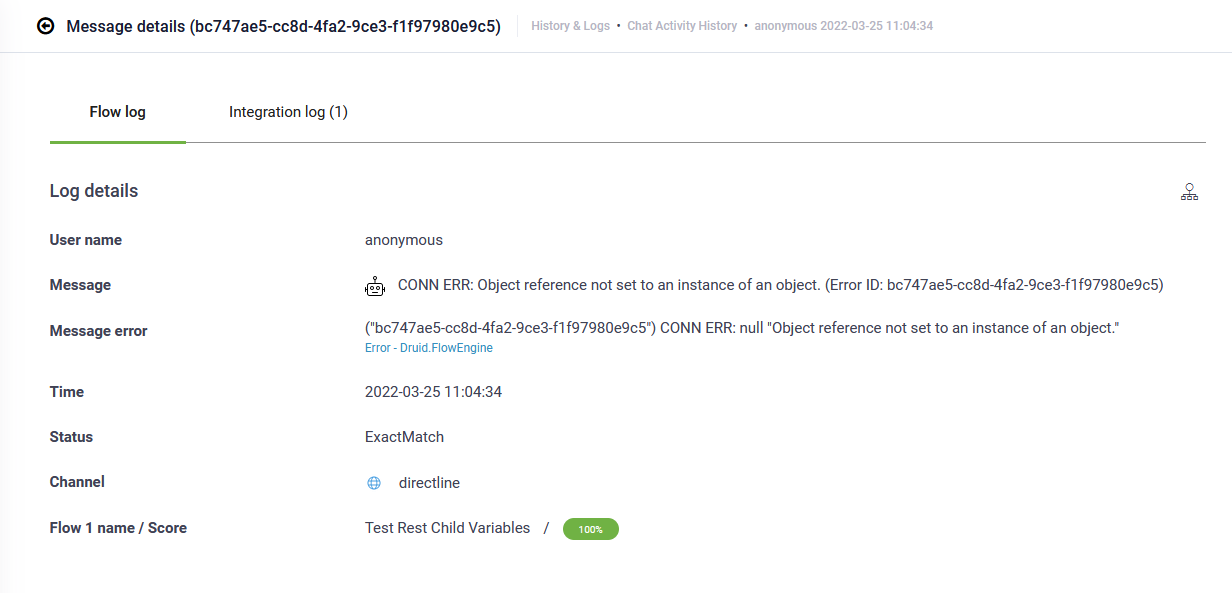
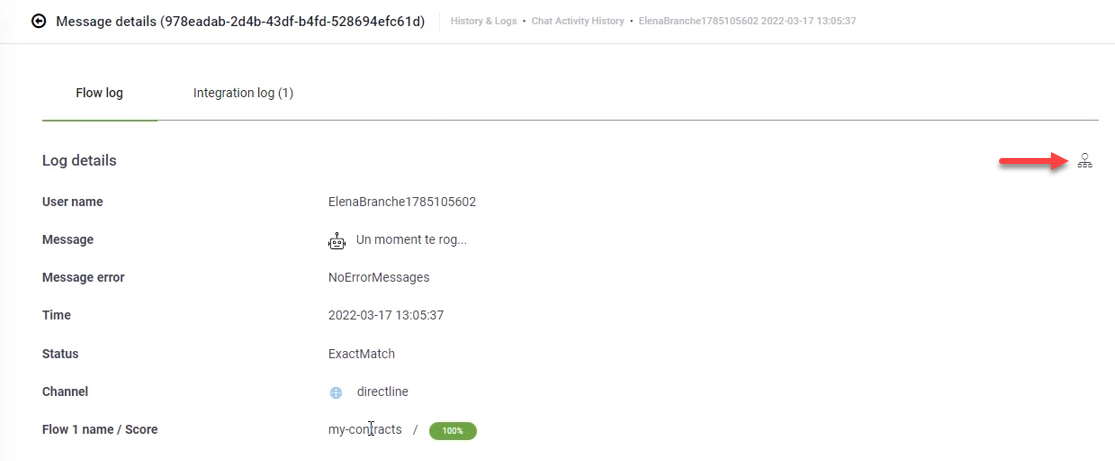
To view a specific message details click the View message details ( ) icon at the right-side of the message. The message details provides you with details from both the Flow log and the Integration log.
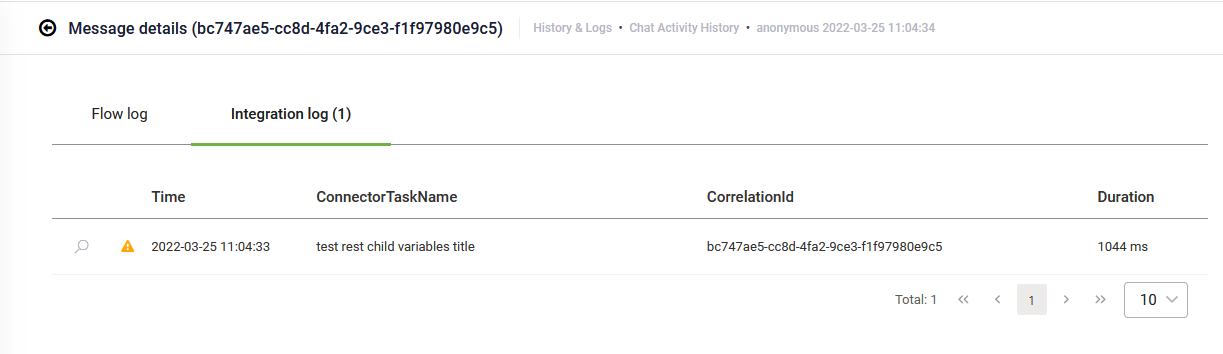
To investigate the integration log without navigating to integrations and connector logs, click the Integration log tab. The list of executed integrations appears. This offers you with a streamlined way to investigate any errors that occurred during the actions execution.
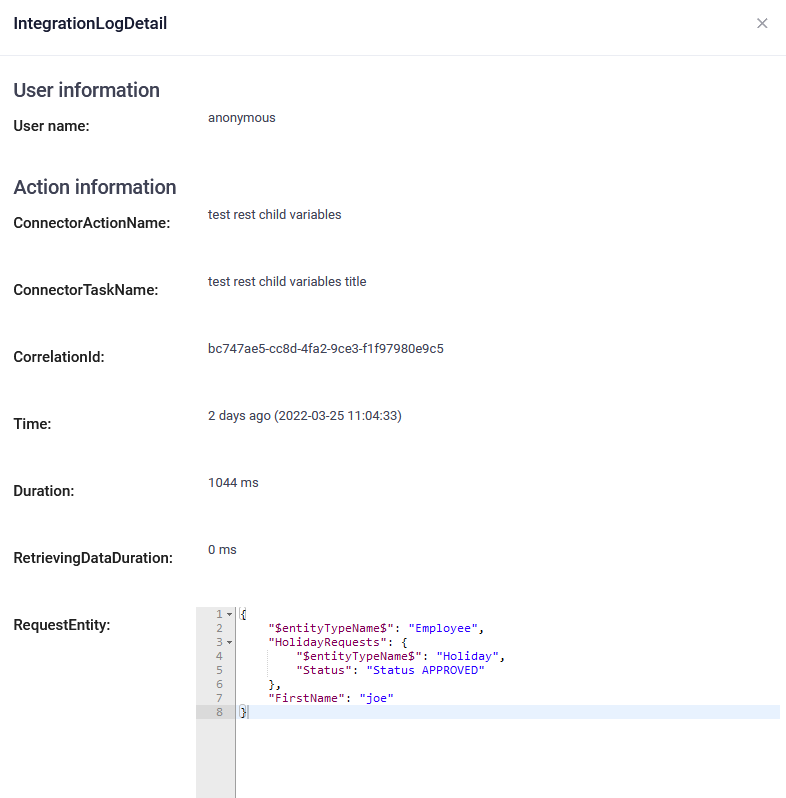
You can further investigate the integration logs by clicking the View details icon in front of the desired record.
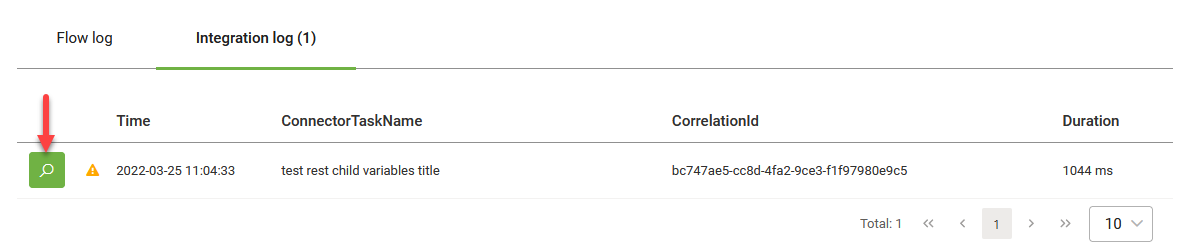
The Integration Log Detail page appears where you can see what happened during the selected connector action execution.
Debugging messages in the flow diagram per flow steps
Druid provides you with extensive debugging capabilities. You can investigate the flow configuration from the message details, Flow log tab, by clicking the flow icon ( ).
).
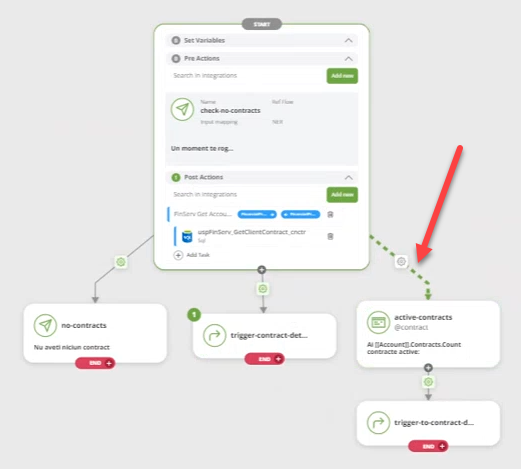
The flow diagram appears in debugging mode with a focus on the flow step where the message was sent.
In the flow diagram, the user path within the flow is automatically marked with green arrows.
In the flow step editor, the conversation transcript of the specific chat activity where the selected message was logged is shown.
By default, the conversation transcript has a focus on the chat activity transcript of the flow step where the selected message was sent.

You can see details of a specific message and the integration log directly in the Flow diagram, by clicking the View message details icon ( ).
).
To view extensive insights of the chat activity, click the Insights tab. The insights provides you with an overview of the conversation activity, the data stored from the context of the [[ChatActivityData]] entity and the list of activity events raised during the chat activity.
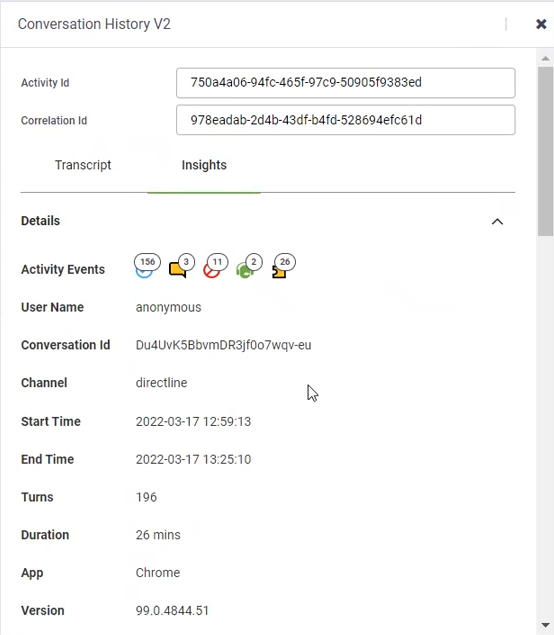
For more information, see Conversation Insights.
Viewing flow steps analytics
Druid enables you to evaluate the bot train set on a flow step level by using the Flow diagram. To access the evaluation tool on a flow step, from the Flow Editor menu, click the Analytics icon.
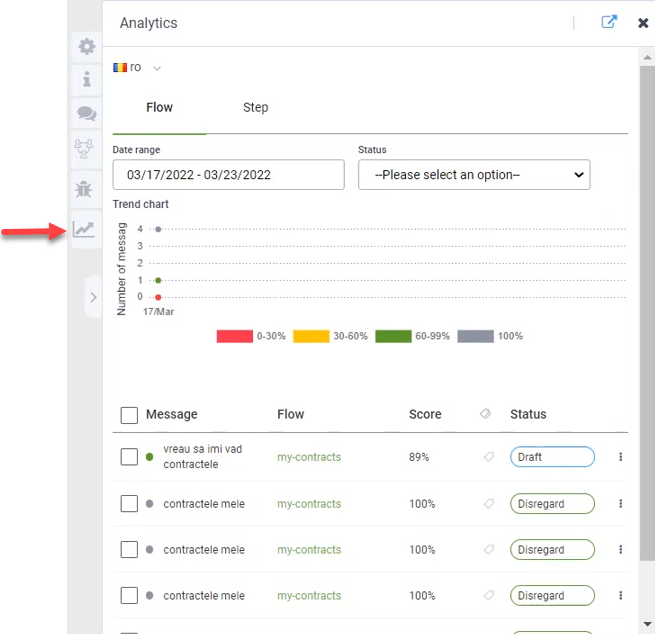
The analytics displays by default on the Flow tab and provides you with the list of utterances that triggered the current flow step, the user messages, their matching score and the status. You can use the Annotation tool to improve the bot-training model.
If you have steps with input mapping that trigger a flow, you can see specific analytics by clicking the Step tab in the Analytics page and in this way you can see all the inputted values by the user in the specific step on a specific period of time.
Debugging messages in the Flow diagram per flow
Druid allows debugging messages in the Flow diagram at a flow level. To do so, in the Conversation transcript, click on the flow name.
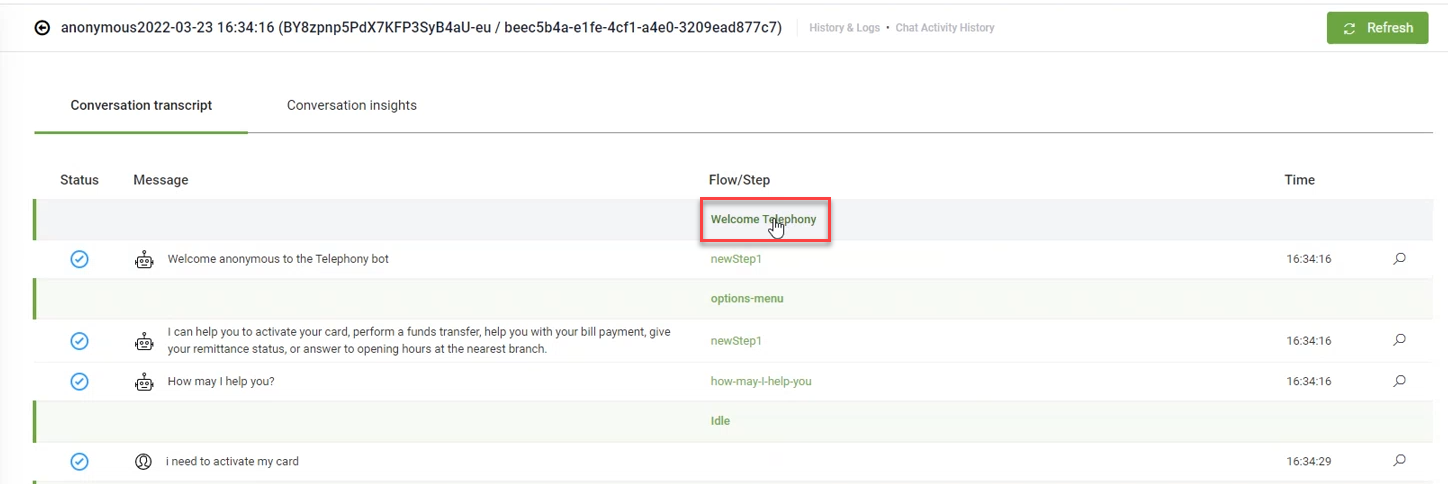
The Flow diagram opens in debugging mode on the selected flow with a focus on the first flow step.
You can further investigate similar to debugging flow steps.